Find your way around the app
The app has four tabs along the bottom: Home, Retirement, Spending and Profile. Home shows your money; the other three each do one job.
What are the four tabs?
| Tab | What it's for |
|---|---|
| Home (house icon) | Your net worth and your accounts |
| Retirement | Your retirement plan |
| Spending | Where your money goes. See Spending |
| Profile (person icon) | Your details, banks, documents and support. See Your profile and details |
On iPhone the tabs have icons only, no words. A dot on the Profile icon means you have unread notifications.
What's on my home screen?
From top to bottom:
- Pending transfers. While an account is moving in from another firm, you'll see a "pending" count. Tap it to see each transfer.
- Net Worth. The total of your open accounts, with a chart. Choose 1M, YTD, 1Y, 3Y, 5Y or All.
- Altitude. How your finances compare with your peers. See Altitude.
- Your Accounts. Each account and its balance. Tap one to open it.
- Your spouse's accounts, if you share with your spouse.
- Sector Exposure and Holdings, added up across the accounts shown.
- Pending. Accounts that are still being opened.
A short line under an account's name tells you what's next, such as Add money, Choose investments or Being approved.
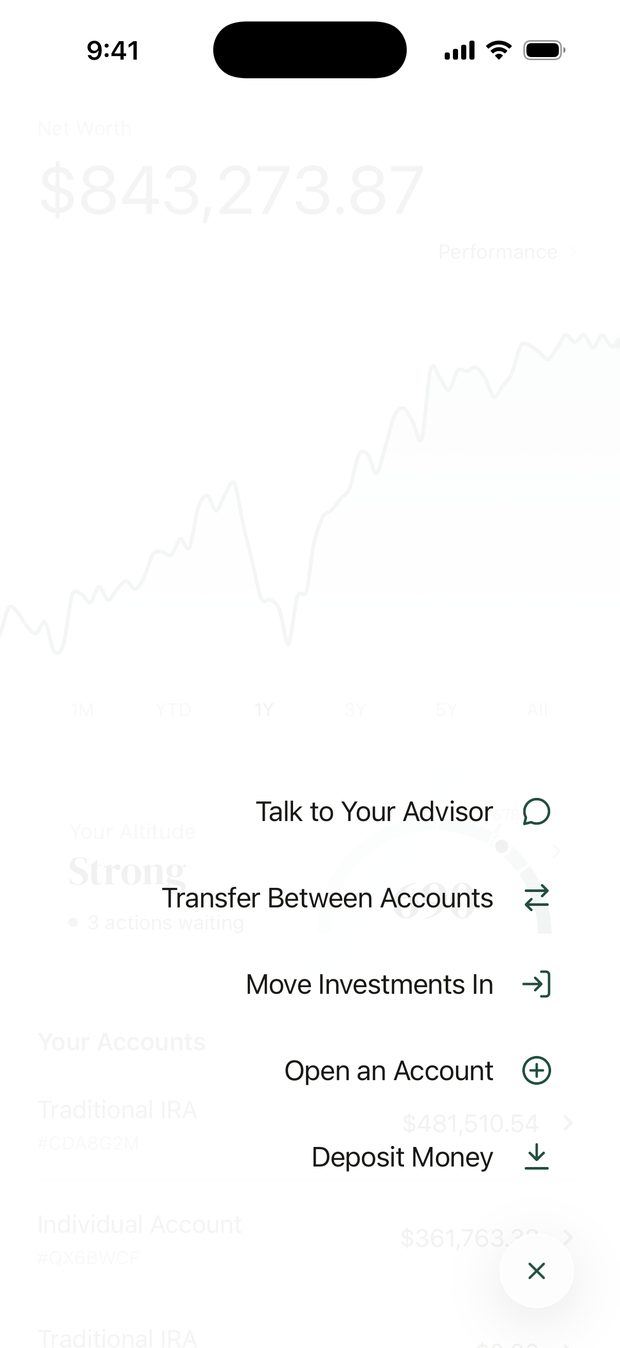
What does the + button do?
Tap + next to the tabs on Home for the most common tasks:
- Deposit Money: add money to an account
- Open an Account: open another account
- Move Investments In: transfer an account from another firm
- Transfer Between Accounts: move cash between two of your alooola accounts
- Talk to Your Advisor: book a call or send an email
On Android, + opens Account Actions, where two items are named Open Account and External Account Transfers.
What do I see before I have an account?
Home shows Start building your portfolio with a few ways to begin: Connect your 401(k) (if your employer's plan works with alooola), Open an account, and Transfer investments from another firm.
What's inside an account?
Tap an account on Home to open it. You'll see:
- Total Balance, with Performance in the corner. See Your returns and holdings.
- Cards you can swipe: Allocation, Performance, Contributions and Exposure. Only cards with something to show appear.
- Recurring investing: your recurring deposit, or a way to set one up.
- Holdings: what the account owns, and what each is worth.
- Deposit and Withdraw at the bottom. A 401(k) has Manage instead.
Tap ⋯ (three dots) in the top corner for the account's settings.
A brand-new account with no money in it shows a setup page instead. It offers a monthly deposit, or One-Time Deposit.
Questions about a figure? Email support@alooola.com with the account and the figure, and we'll look into it.